Data Products for Tsunami Risk Assessment
Damage scales, fragility curves, consequence models, vulnerability curves, loss curves
The Tsunami data product in ETRiS provides access to various PTRA components, including damage scales, fragility curves, consequence functions, vulnerability curves, and loss curves.
Check out the Fragility and Vulnerability curves from the link below.
The taxonomy used for labeling elements exposed to risk is GED4ALL, which is extended version of the Global Exposure Database for the Global Earthquake Model (Silva et al. 2018, Murnane et al. 2019)
Description of each Data Product components
DAMAGE SCALES
– Description of Damage scale:
Damage scale is the ensemble of mutually exclusive and collectively exhaustive damage states (DSi) used to describe the whole range of possibilities of damage for an exposed asset (Buildings or other structure). Damage levels Dj are the thresholds that separate the different damage states (DSi).
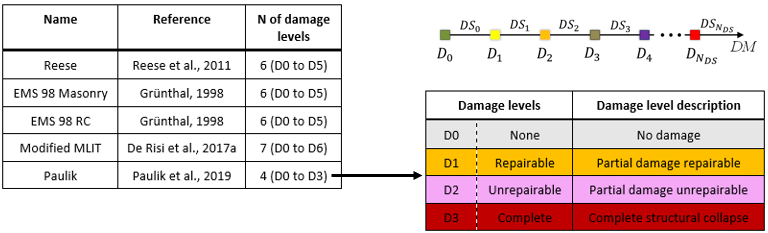
Figure 1:Table of different damage scales introduced in literature with Graphical representation of damage levels Dj and damage states DSj, where j=0-NDS. An example of damage scale with 4 damage level (Paulik et al. 2019).
You can download and use damage scale data product from the ETRiS GitHub repository at:
ETRiS Damage Scales
FRAGILITY CURVES
– Description of fragility curves
The probability of exceeding a given damage level (DSj) given a certain Intensity Measure (IM). Fragility curves can be calculated either through structural analysis (analytical approach) or by observing the local damage from a previous tsunami event (empirical approach). ETRiS currently provides empirical fragility curves. These curves are all derived using the software computeFrag Version 2 (see the Tsunami Risk Toolkit page).
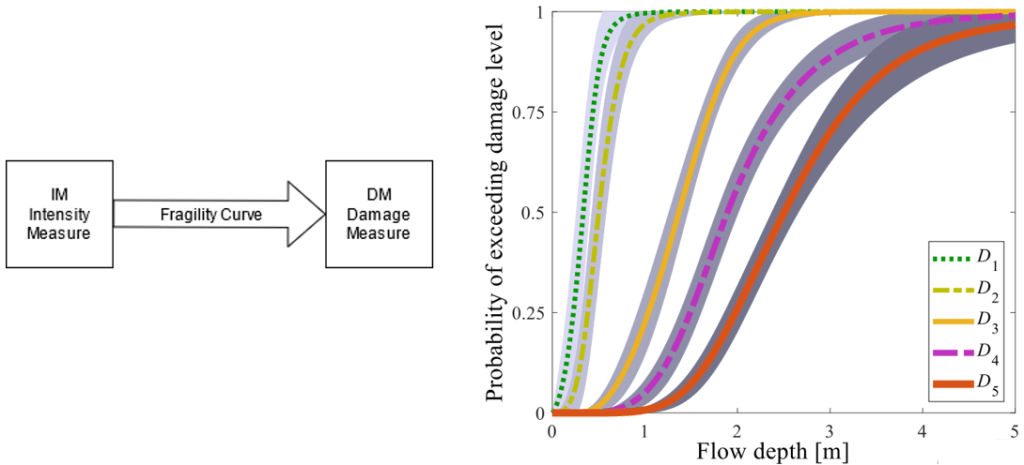
Figure 2 : Fragility curve relation with different variables. The fragility curve defines as the probability of exceeding the a given damage level (DSj) given a certain Intensity Measure (IM)
Metadata: Fragility_Curve_metadata
includes information about the fragility curves provided on the repository. It includes: building classes, damage scale, type of generalized regression model used, as well as information about the original paper where these curves have been published for the first time. (Note: the fragility curves provided by ETRiS are all re-postprocessed using the compFrag software version 2.) The original papers provide information about the raw data and documentation for the original fragility curves.
You can download and use fragility curve data product from the ETRiS GitHub repository at:
ETRiS Fragility Curves Repo
The README file provides essential information about the fragility curve repository
CONSEQUENCE MODELS
– Description of Consequence model
The conditional probability distribution (e.g., mean, and standard deviation) of a decision variable DV (e.g., fatalities, economic loss) for prescribed damage states.
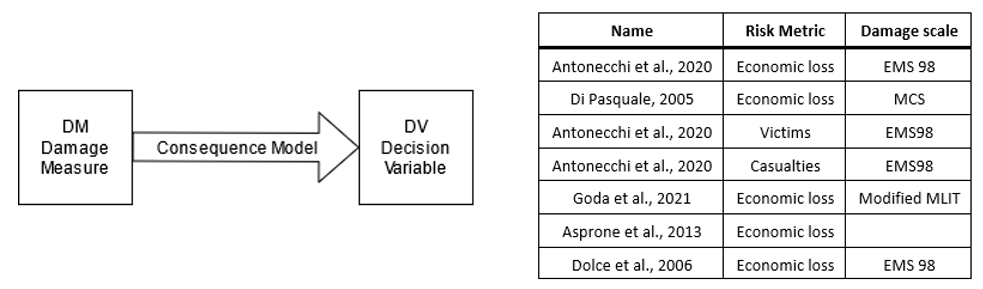
Figure 3 : Consequence model relation with different variables. table shows examples of consequence models in literature.
You can download and use consequence models data product from the ETRiS GitHub repository at:
ETRiS Consequence Models
VULNERABILITY CURVES
– Description of vulnerability curves
The conditional probability distribution (e.g., mean and standard deviation) of a decision variable DV (e.g., fatalities, economic loss) as a function of the intensity measure IM.

Figure 4 : Vulnerability curve relation with different variables. The vulnerability curve defines as the probability distribution (e.g., mean and standard deviation) of a decision variable DV (e.g., fatalities, economic loss) as a function of the intensity measure IM
Metadata: Vulnerability_Curve_metadata includes building classes for different events, on different damage scales, and using different modeling processes, as well as information about their contributors. Note: the Vulnerability curves provided by ETRiS are all re-postprocessed using the compFrag software version 2. The original papers provide information about the raw data and documentation for the original Vulnerability curves.
You can download and use vulnerability curve data product from the ETRiS GitHub repository at:
ETRiS Vulnerability Curves Repo
The README.md provides essential information about the vulnerability curve repository
LOSS CURVES
– Description of loss curves
Loss curves provide the mean annual rate of exceeding specific thresholds dv for the decision variable DV. ETRiS is currently preparing the loss curves to be shared on the repository.
ّFeedback form:
After using each data products, click here to share your feedback.
METADATA
Use this table to access the most update metadata of our empirical fragility data products and information on their contributors.
———————–
Use this table to access the most update metadata of our empirical vulnerability data products and information on their contributors.
This website is developed and maintained by researchers at the University College London and University of Naples Federico II.
License
Media use
© 2025 – European Tsunami Risk Service (ETRiS)

![]()